
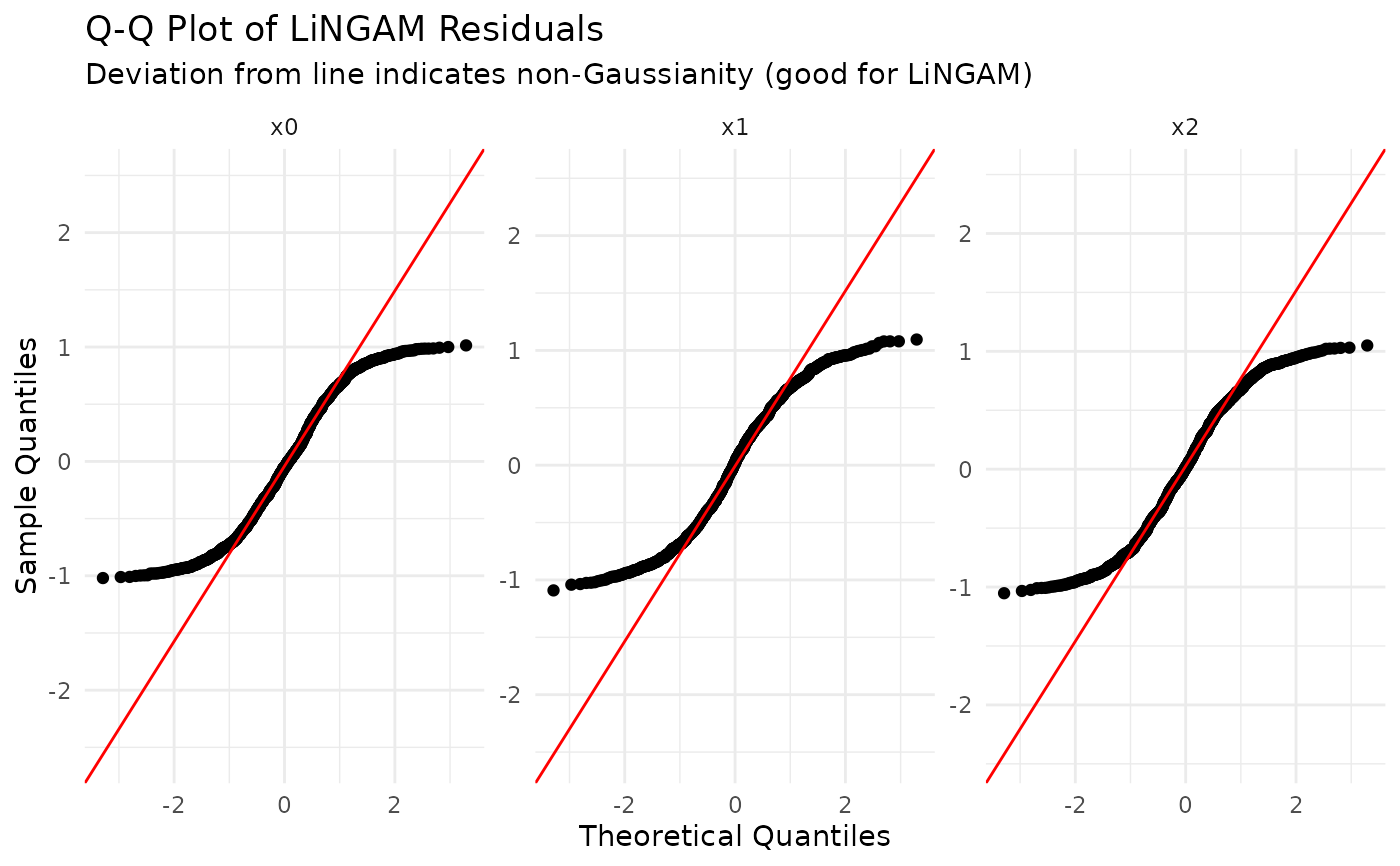
Draws per-variable normal Q-Q plots of the residuals (analogous to the Moneta
Gauss_Stats visual check). Deviations from the reference line indicate
non-Gaussianity, which supports the LiNGAM assumption. Requires ggplot2.
Usage
plot_varlingam_residual_qq(
  result,
  on = c("innovations", "var"),
  ncol = 3,
  nrow = NULL
)
Arguments
- result
a
VARLiNGAMResultfromlingam_var()- on
which series to plot: "innovations" (default) or "var"
- ncol
number of facet columns
- nrow
number of facet rows (NULL = automatic)
References
Analogous to the residual visual check (Gauss_Stats) in the VARLiNGAM R code of Moneta, A., Entner, D., Hoyer, P. O., & Coad, A. (2013), Oxford Bulletin of Economics and Statistics, 75(5), 705-730. https://sites.google.com/site/dorisentner/publications/VARLiNGAM
Examples
s <- generate_varlingam_sample(n = 1000, seed = 42)
m <- lingam_var(s$data, lags = 1, reg_method = "ols", prune = FALSE)
# \donttest{
plot_varlingam_residual_qq(m)
 # }
# }