
LiNGAM is a method for estimating structural equation models or linear Bayesian networks. It is based on using the non-Gaussianity of the data.
lingamr is a port to R of the LiNGAM package (LiNGAM: Linear Non-Gaussian Acyclic Model), which is available in Python.
Features
- Direct LiNGAM (
lingam_direct()), with selectable regression backends (OLS, LASSO, adaptive LASSO, ridge) for adjacency-matrix estimation - VAR-LiNGAM (
lingam_var()) for time series causal discovery, and VARMA-LiNGAM (lingam_varma()) when errors follow a moving-average process - Algorithms robust against latent confounders: BottomUpParceLiNGAM (
lingam_parce()) and RCD (lingam_rcd()) - MultiGroupDirectLiNGAM (
lingam_multi_group()) for jointly estimating a shared causal order across multiple datasets - HighDimDirectLiNGAM (
lingam_high_dim()) for high-dimensional data (largep, orp > n) - Algorithms for nonlinear causal discovery: RESIT (
lingam_resit()) and CAM-UV (lingam_camuv(), which also detects unobserved confounders) - LiM (
lingam_lim()) for causal discovery on mixed continuous, binary, and Poisson count data -
bootstrap_with_imputation()for causal discovery on data with missing values, andevaluate_model_fit()for SEM-based fit evaluation via lavaan - Stability assessment of causal structures using the bootstrap method, including causal-order stability
- Model diagnostics: residual independence / normality tests and a one-call
summary_lingam() - Visualization with DiagrammeR (interactive) and ggplot2
autoplot()(static) - broom-style tidiers (
tidy()/glance())
This package does not include all the features of the Python version, and it also includes some features that are not present in the Python version.
Installation
You can install lingamr from CRAN with:
install.packages("lingamr")Or install the development version from GitHub with:
# install.packages("pak")
pak::pak("morimotoosamu/lingamr")
Some functionality relies on the following suggested packages: DiagrammeR (interactive plots), igraph and ggplot2 (static autoplot() graphs and QQ plots), glmnet (adaptive LASSO), and nortest / tseries (residual tests).
Quick start
library(lingamr)

# Generate sample data from a 6-variable LiNGAM model
x <- generate_lingam_sample_6(n = 1000)

# Estimate the causal structure with Direct LiNGAM
model <- lingam_direct(x$data)

# Estimated causal order (as variable names)
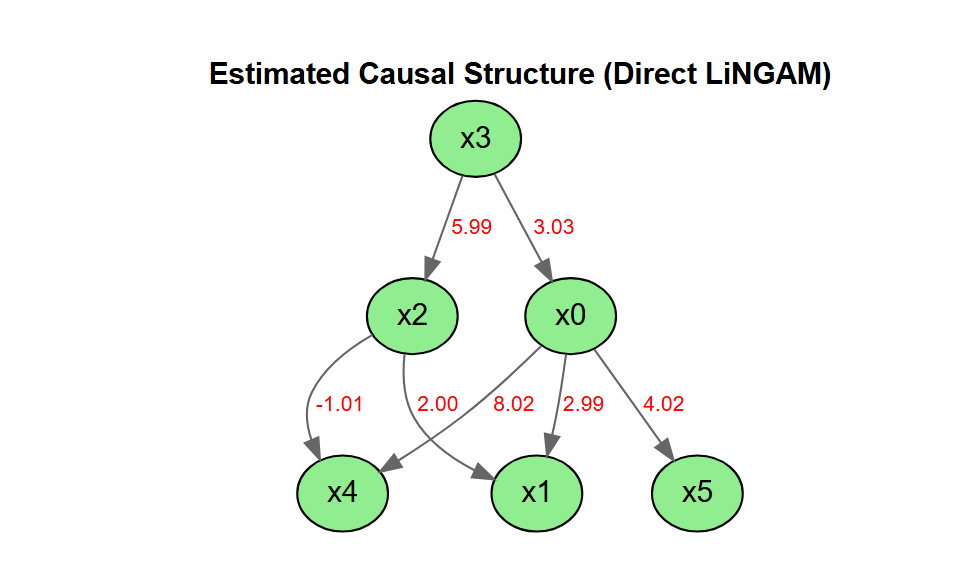
colnames(x$data)[model$causal_order]
#> [1] "x3" "x2" "x0" "x4" "x5" "x1"
# Visualize the estimated causal graph
model$adjacency_matrix |>
  plot_adjacency(
    labels    = colnames(model$adjacency_matrix),
    title     = "Estimated Causal Structure (Direct LiNGAM)",
    rankdir   = "TB",
    shape     = "ellipse",
    fillcolor = "lightgreen"
  )
Learn more
Start with the introductory vignette for the core idea and a minimal end-to-end workflow:
vignette("lingamr")For choosing the right estimator (time series, latent confounders, nonlinear relationships, mixed or missing data), see vignette("method-selection"). Detailed guides — prior knowledge, total causal effects, residual independence and normality tests, bootstrap (including parallel execution), and more — live on the package website.
Licence
MIT License
Original work: Copyright (c) 2019 T.Ikeuchi, G.Haraoka, M.Ide, W.Kurebayashi, S.Shimizu
Portions of this work: Copyright (c) 2026 O.Morimoto
References
Algorithm
- Shimizu, S. et al. (2011). DirectLiNGAM: A direct method for learning a linear non-Gaussian structural equation model. Journal of Machine Learning Research, 12, 1225-1248.
Original Implementation (Python)
- Ikeuchi, T. et al. (2023). Python package for LiNGAM algorithms. Journal of Machine Learning Research, 24(14), 1-7. https://github.com/cdt15/lingam
Books
- 清水昌平(2017)『統計的因果探索』講談社.
- 梅津佑太・西村龍映・上田勇祐(2020)『スパース回帰分析とパターン認識』講談社.
- 鈴木譲(2025)『グラフィカルモデルと因果探索100問 with R』共立出版.
R Packages Referenced
- G. Kikuchi (2020). rlingam https://github.com/gkikuchi/rlingam
Acknowledgments
We thank the following people and organization for their support in developing this package:
- Hirohiko Asano
- Yoshiyuki Okuse
- Takahiko Umeyama
- JMRA (Japan Marketing Research Association)
Development of this package was assisted by AI coding tools (Google Gemini and Anthropic Claude). The author reviewed, tested, and validated all AI-generated code.