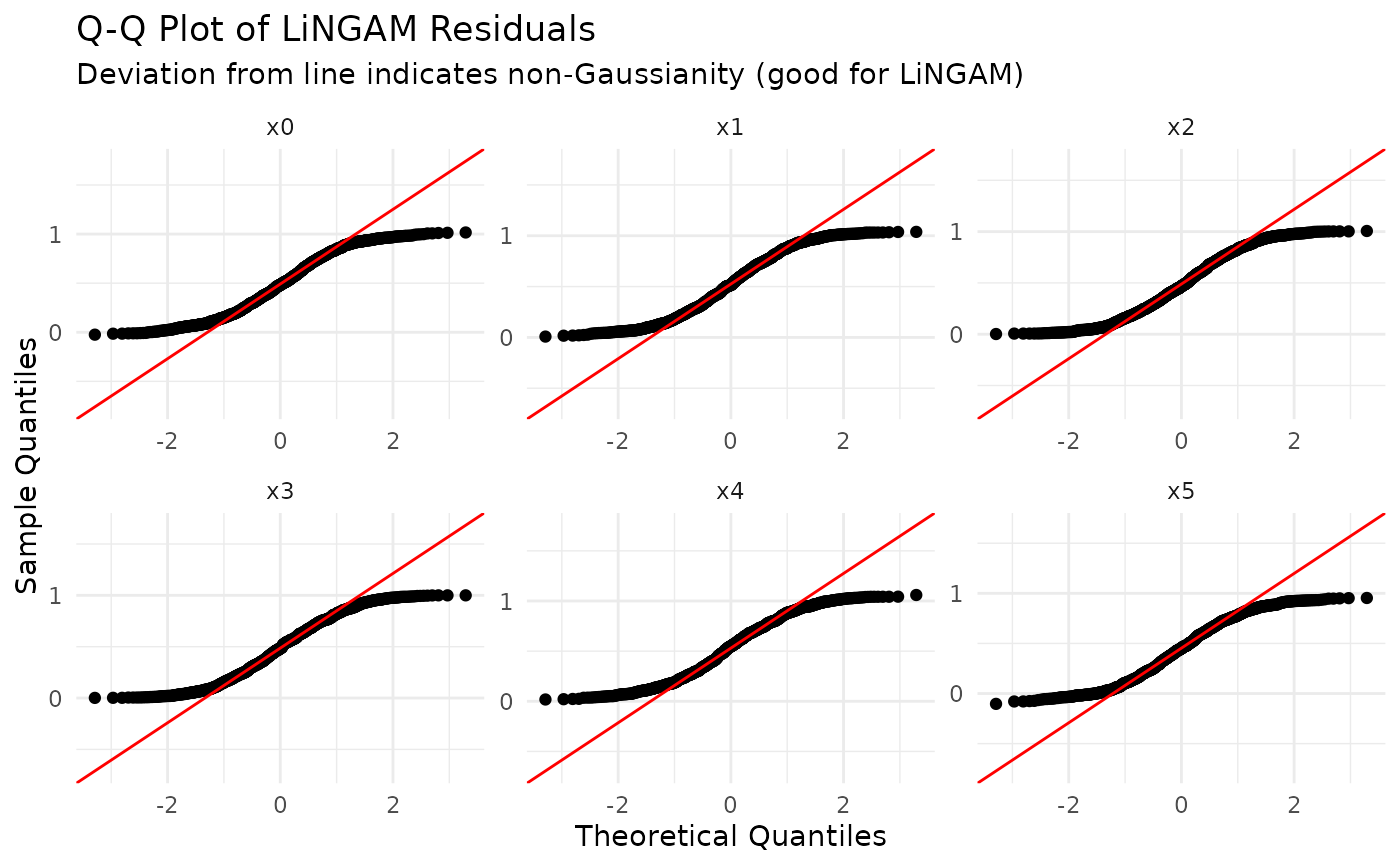
plot QQ
Value
A ggplot2::ggplot object with QQ plots of residuals.
Examples
if (requireNamespace("ggplot2", quietly = TRUE)) {
  # Load the sample data
  LiNGAM_sample_1000 <- generate_lingam_sample_6()

  # Run Direct LiNGAM
  result <- lingam_direct(LiNGAM_sample_1000$data, reg_method = "ols")

  plot_residual_qq(LiNGAM_sample_1000$data, result)
}