
Plot one group of a MultiGroupLingamResult with ggplot2
Source:R/autoplot.r
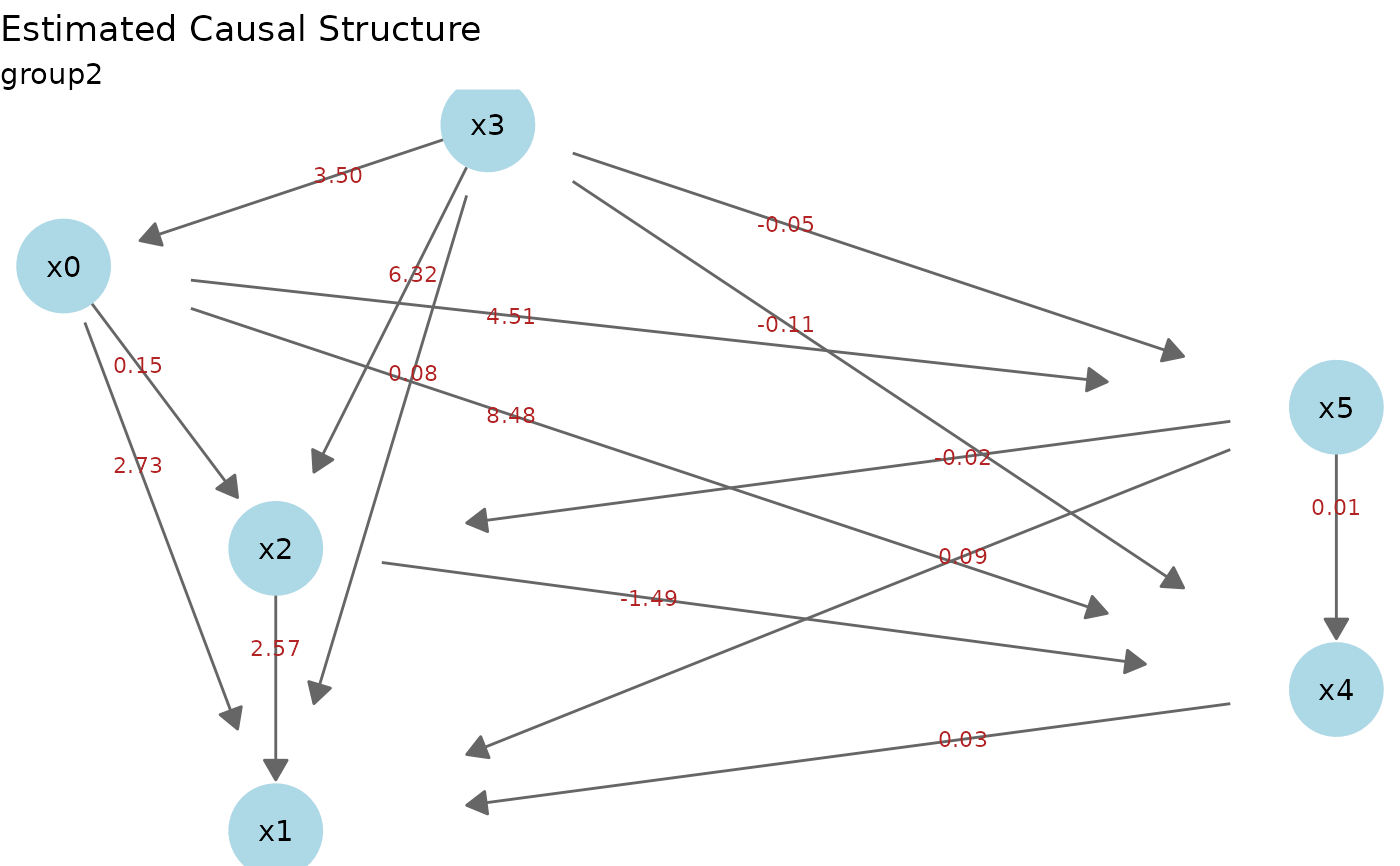
autoplot.MultiGroupLingamResult.RdExtracts a single group's result with get_group_result() and draws it
like autoplot.LingamResult(), with the group shown in the subtitle. The
causal order is shared across groups, but the coefficients (and therefore
the plotted edges) are group specific.
Usage
# S3 method for class 'MultiGroupLingamResult'
autoplot(
  object,
  group = 1,
  threshold = 0,
  node_size = 16,
  node_color = "lightblue",
  label_edges = TRUE,
  label_pos = 0.35,
  ...
)
Arguments
- object
Return value of
lingam_multi_group()(aMultiGroupLingamResultobject)- group
Which group to plot: a group name (character) or a 1-based index (default: 1)
- threshold
Coefficients with an absolute value at or below this are not treated as edges (default: 0)
- node_size
Node size (default: 16)
- node_color
Node fill color (default: "lightblue")
- label_edges
Whether to display coefficient labels on edges (default: TRUE)
- label_pos
Position of each coefficient label along its edge, as a fraction from the source (0) to the target (1). The default 0.35 places labels off-center (toward the source) so labels on crossing edges do not overlap near the midpoint.
- ...
Unused
Examples
# \donttest{
if (requireNamespace("ggplot2", quietly = TRUE) &&
requireNamespace("igraph", quietly = TRUE)) {
library(ggplot2)
mg <- generate_multi_group_sample()
model <- lingam_multi_group(mg$data_list, reg_method = "ols")
autoplot(model, group = 2)
}
 # }
# }